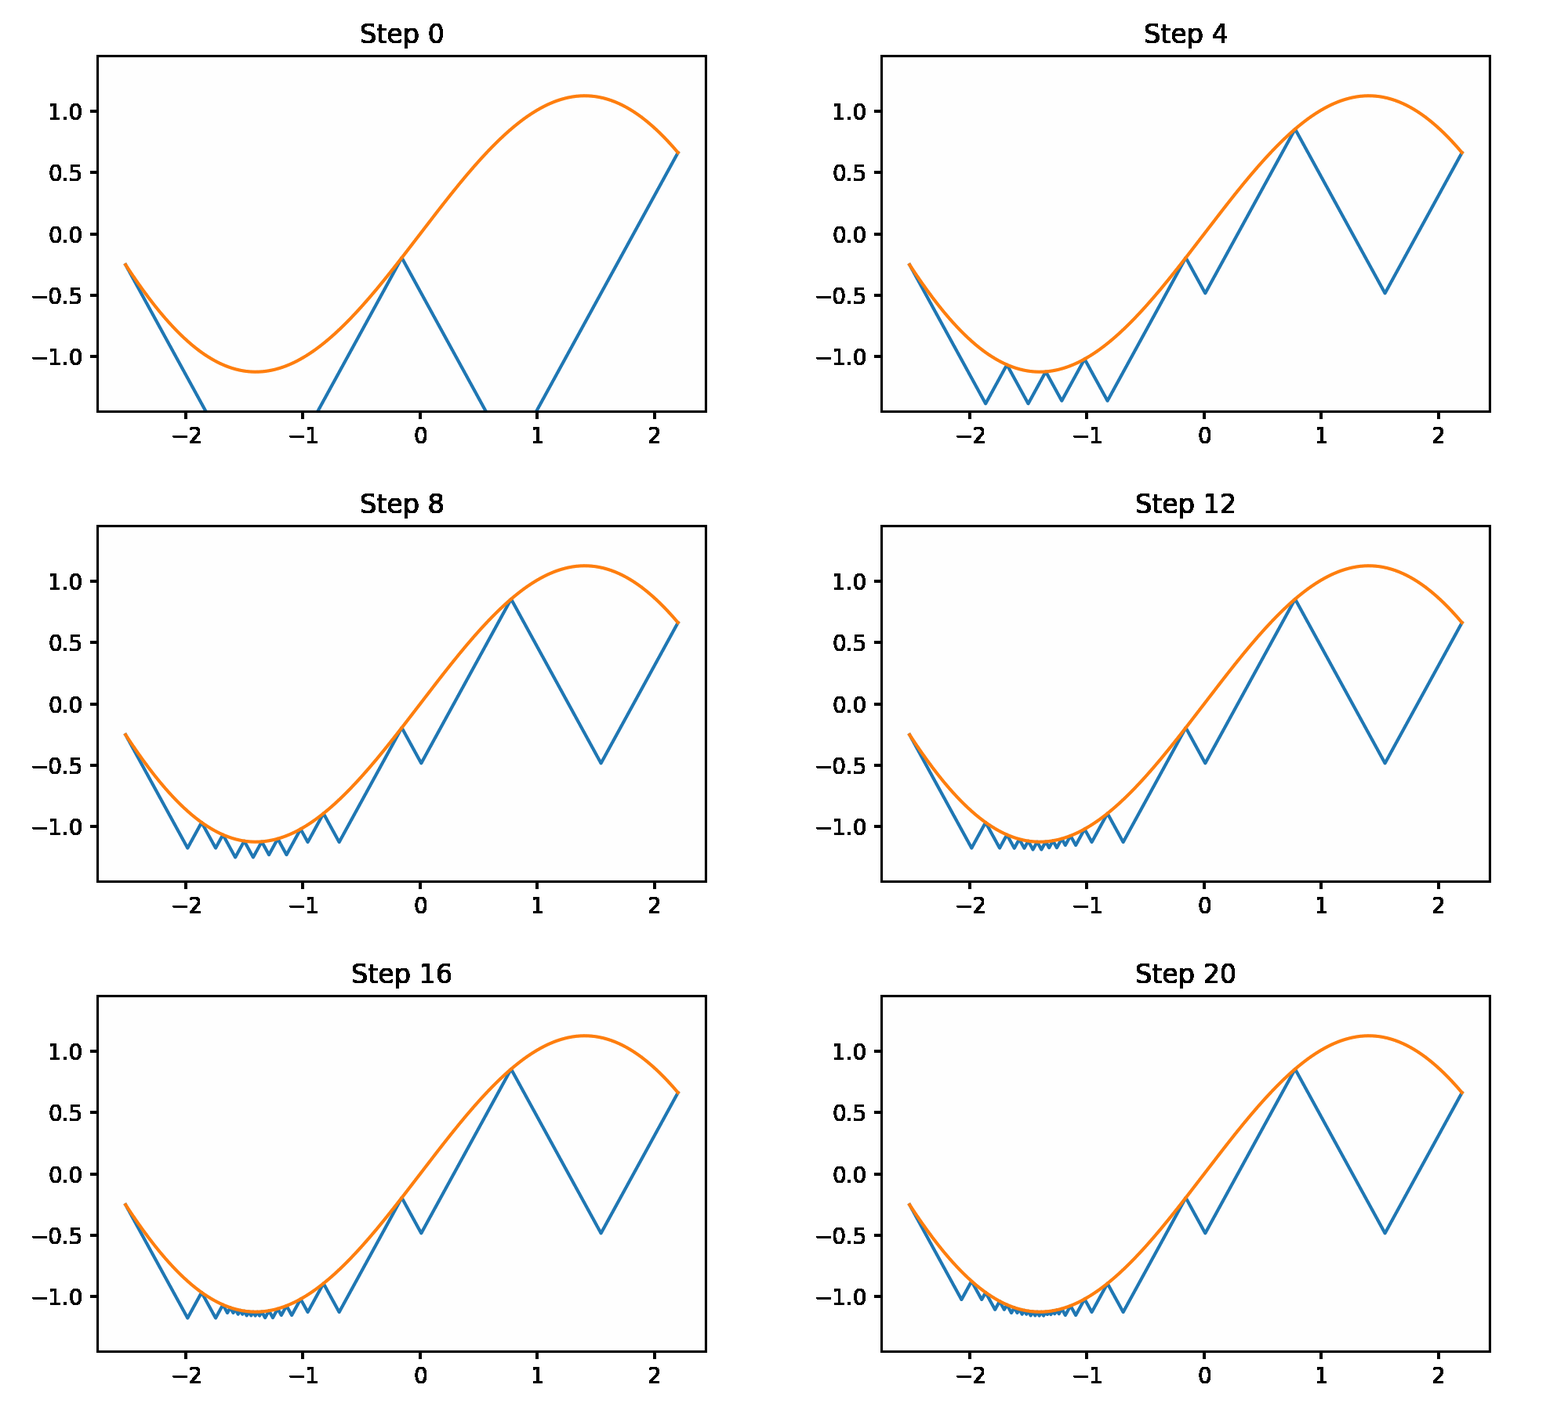
I came across this method the other week, and I think it is an elegant way to tackle 1D global optimization. The Shubert-Piyavskii method is a global optimization method that is guaranteed to converge to the global minimum of a function. The method requires that the function that we are trying to minimize be Lipschitz continuous and that we know a reasonable upper bound of the constant. This is, in effect a, stipulation that the magnitude of the derivative is bounded. One of the disadvantages of this method is that you must know either the Lipchitz constant or a reasonable number the minimally bounds the Lipchitz constant.
I have adapted the Julia source code from “Algorithms for Optimization” by Kochenderfer.
import dataclasses

@dataclasses.dataclass
class Point:
    x: float
    y: float

def get_intersection(A:Point, B:Point, l:float):
    t = ((A.y - B.y) - l*(A.x - B.x))/(2*l)
    return Point(A.x + t, A.y - t*l)

def shubert_piyavskii(f, a:float, b:float, l:float, epsilon:float, output_data = False):

    data_points = list()
    m = .5*(a+b)
    A,M,B = Point(a, f(a)), Point(m, f(m)), Point(b, f(b))
    points = [A, get_intersection(A, M, l), M, get_intersection(M,B,l), B]
    delta = numpy.infty

    while delta > epsilon:
        if output_data == True:
            data_points.append(points.copy())
        i = numpy.argmin([P.y for P in points])
        P = Point(points[i].x, f(points[i].x))
        delta = P.y - points[i].y

        P_prev = get_intersection(points[i-1], P, l)
        P_next = get_intersection(P, points[i+1], l)

        points.pop(i)
        points.insert(i, P_next)
        points.insert(i, P)
        points.insert(i, P_prev)

        plt.show()

    return points[numpy.argmin([P.y for P in points])].x, data_points
This method generates successive under estimators for the function from the Lipchitz constant information (these are the cones). Then it evaluates the lowest under estimator. It iterates until the difference between the under estimator is within 1 epsilon of the global min. This iterative procedure is also called the sawtooth method to become clear when looking at the animation.

The code to generate the plot is included. This uses the python gif library.
import gif

def func(x):
    return 1.5*numpy.sin(x)-.25*x

minimum, func_info = shubert_piyavskii(func, -numpy.pi*.8, numpy.pi*.7, 1.75, .05, True)

x_ = numpy.linspace(-numpy.pi*.8, numpy.pi*.7, 1000)
y_ = func(x_)

@gif.frame
def plot_step(i:int):
    points_i = func_info[i]
    fig, ax = plt.subplots(figsize=(5,3), dpi = 200)
    ax.plot([P.x for P in points_i], [P.y for P in points_i])
    ax.plot(x_, y_)
    ax.set_title(f'Step {i}')
    ax.set_ylim((-1.45, 1.45))

frames = []

for i in range(len(func_info)):
    frame = plot_step(i)
    frames.append(frame)

gif.save(frames, 'sawtooth.gif', duration=5, unit='s', between='startend')